Software
Data Insight
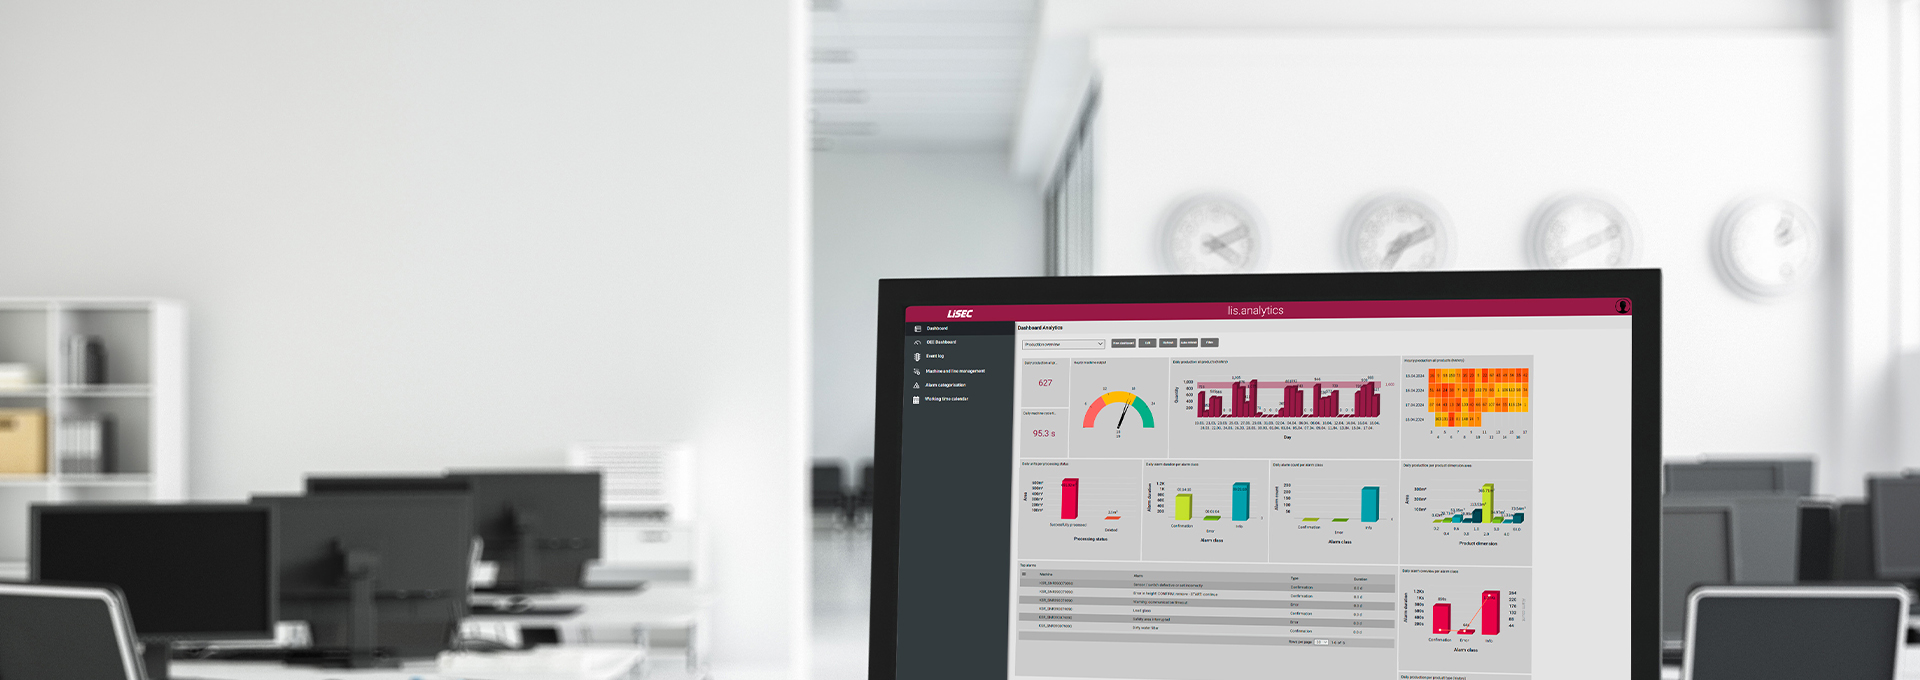
lis.analytics
Transparency in production based on data
It can pose a major challenge to maintain an overview in a production facility that consists of a large number of machines and systems. How many units or what area was produced on all systems today? What was the product mix like today? What alarms were triggered and how quickly were the problems resolved? These are the kinds of questions that we want and need to answer, for a day or for a single shift, for a single machine or an entire line. It's also vital to be in a position to compare the figures for a day or a shift so that you can be sure that you are constantly improving.
lis.analytics makes it much easier to find answers and take action.
HOW IS LIS.ANALYTICS STRUCTURED?
The data with which lis.analytics works is provided directly by the machines, collected by the LiSEC Edge Box and transferred to the Microsoft Azure Cloud. Here, this data is correspondingly prepared, pre-calculated and stored in databases for lis.analytics. We call this combination of machine data interface, Edge Box and cloud infrastructure the LiSEC IoT platform.
HOW DOES LIS.ANALYTICS WORK?
Data is generated at different locations in production. One of these sources is the machine itself, where data regarding the machine status, the manufactured product or even alarms that have occurred is generated. This data is used by different systems - for example to generate completion notifications. The LiSEC Edge Box transfers a part of this data to the Microsoft Azure Cloud for further processing.
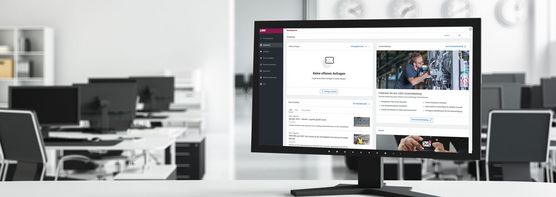
The data is aggregated and KPIs are pre-calculated in the cloud environment. lis.analytics visualises this data and enables filtering so that potentials can be identified and appropriate measures derived.
WHO IS LIS.ANALYTICS SUITABLE FOR?
In order to use lis.analytics, the machines must already generate and provide the necessary data. Get in touch with your LiSEC representative to find out if your machines already do this.
WHAT BENEFITS DOES the software OFFER?
The increased transparency that lis.analytics offers simplifies the management of production, because it is possible to determine exactly where there is potential scope for improvement and how great its impact is on current production. The basis for this is alarms that lead to downtimes, although also waiting times that occur with machines, right up to a precise analysis of the product mix.
WHAT FUNCTIONS ARE INCLUDED AS STANDARD?
Live Performance Monitoring - custom dashboards for the transparent presentation of production figures in real time. This feature is included in the LiSERV service contract.
WHICH OPTIONAL FUNCTIONS CAN BE ADDED?
Productivity Analysis – OEE Dashboard, Management of shifts and analysis for one shift, management of lines and analysis of production data for entire lines, analysis of historical data
- Custom dashboard
- Overall Equipment Effectiveness (OEE)
- Analyses according to shift plan and for lines
- Systems & Lines
- Individual Machines
- Software


